Guanabara Bay Report Card
Conceptualization: determining values and threats
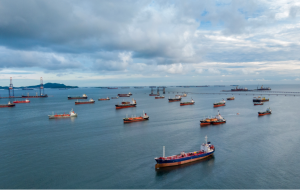
The first step of a report card is to determine the values and threats of the system and develop a conceptual diagram. For Guanabara Bay, stakeholders in the region attended two workshops and filled out surveys to determine the key features, values, and threats. The conceptualization activities identified Guanabara Bay as a beautiful natural harbor that helps form the identity of the Rio de Janeiro region. Guanabara Bay supports the Brazilian economy, through activities like shipping, recreation and tourism. Urban development results in significant impacts including litter and untreated sewage leading to bacterial contamination. In addition, industrial and agricultural development can result in contaminated runoff. These values and threats are informing the selection of report card indicators.

The second step of the report card process is to choose regions and indicators that will be measured to determine the health of the system. For Guanabara Bay both the bay and its basin were divided into sub-regions. Potential indicators were chosen for each one.
Five reporting regions for Guanabara Bay were identified in a recent assessment (Fistarol et al., 2015) based on flushing rates, bathymetry and natural features. Water quality indicators have been integrated into a water quality index (INEA) for marine waters. This index includes five indicators of water quality:
- dissolved oxygen
- total phosphorus
- dissolved nitrate
- dissolved ammonium
- bacterial contamination
Additional indicators will be considered for inclusion based on current data availability, frequency of collection, and relevance.
The Guanabara Bay River Basin was separated into six reporting regions by combining natural watersheds into larger groups with adequate sampling resolution. Nine water quality indicators have been integrated into a water quality index: DO, biological oxygen demand, total phosphorus, nitrate, pH, turbidity, total dissolved solids, air/water temperature, and thermotolerant coliforms. Additional indicators are also being examined for the basin.
As this project continues, in addition to a printed report card product, a digital platform showing the Guanabara Bay Report Card will be available. This platform will be a place where maps of the region and data will be displayed, as well as the final report card scores and grades. Some examples of other report cards currently available on the platform are the Chesapeake Bay Report Card (opens in a new tab) and the Long Island Sound Report Card (opens in a new tab).

