
Chesapeake Bay Health Score Held Steady in 2021
The 2021 Chesapeake Bay and Watershed Report Card issued today by the University of Maryland Center for Environmental Science (UMCES) gives the overall Chesapeake watershed a grade of C+ for 2021. The Chesapeake Bay health score improved slightly from 45 to 50, a grade of C. Building on social indicators that were added in 2021, new economic indicators were used to evaluate the health of local economies in the region. These include Median Household Income, Jobs Growth, Income Inequality, and Housing Affordability.

New Economic indicators added for Chesapeake Watershed:
Median Household Income, Jobs Growth, Income Inequality, and Housing Affordability
The 2021 Chesapeake Bay and Watershed Report Card issued today by the University of Maryland Center for Environmental Science (UMCES) gives the overall Chesapeake watershed a grade of C+ for 2021. The Chesapeake Bay health score improved slightly from 45 to 50, a grade of C. Building on social indicators that were added in 2021, new economic indicators were used to evaluate the health of local economies in the region. These include Median Household Income, Jobs Growth, Income Inequality, and Housing Affordability.
”The health of the Chesapeake Bay is a reflection of what is happening across its watershed, which includes six states and the District of Columbia and more than 18 million people,” said Dr. Peter Goodwin, University of Maryland Center for Environmental Science. “This year’s report card is the first to include a range of economic, ecological, and societal factors to help assess progress in improving this vast human and natural system that is a major component of the quality of life for people in the region.”
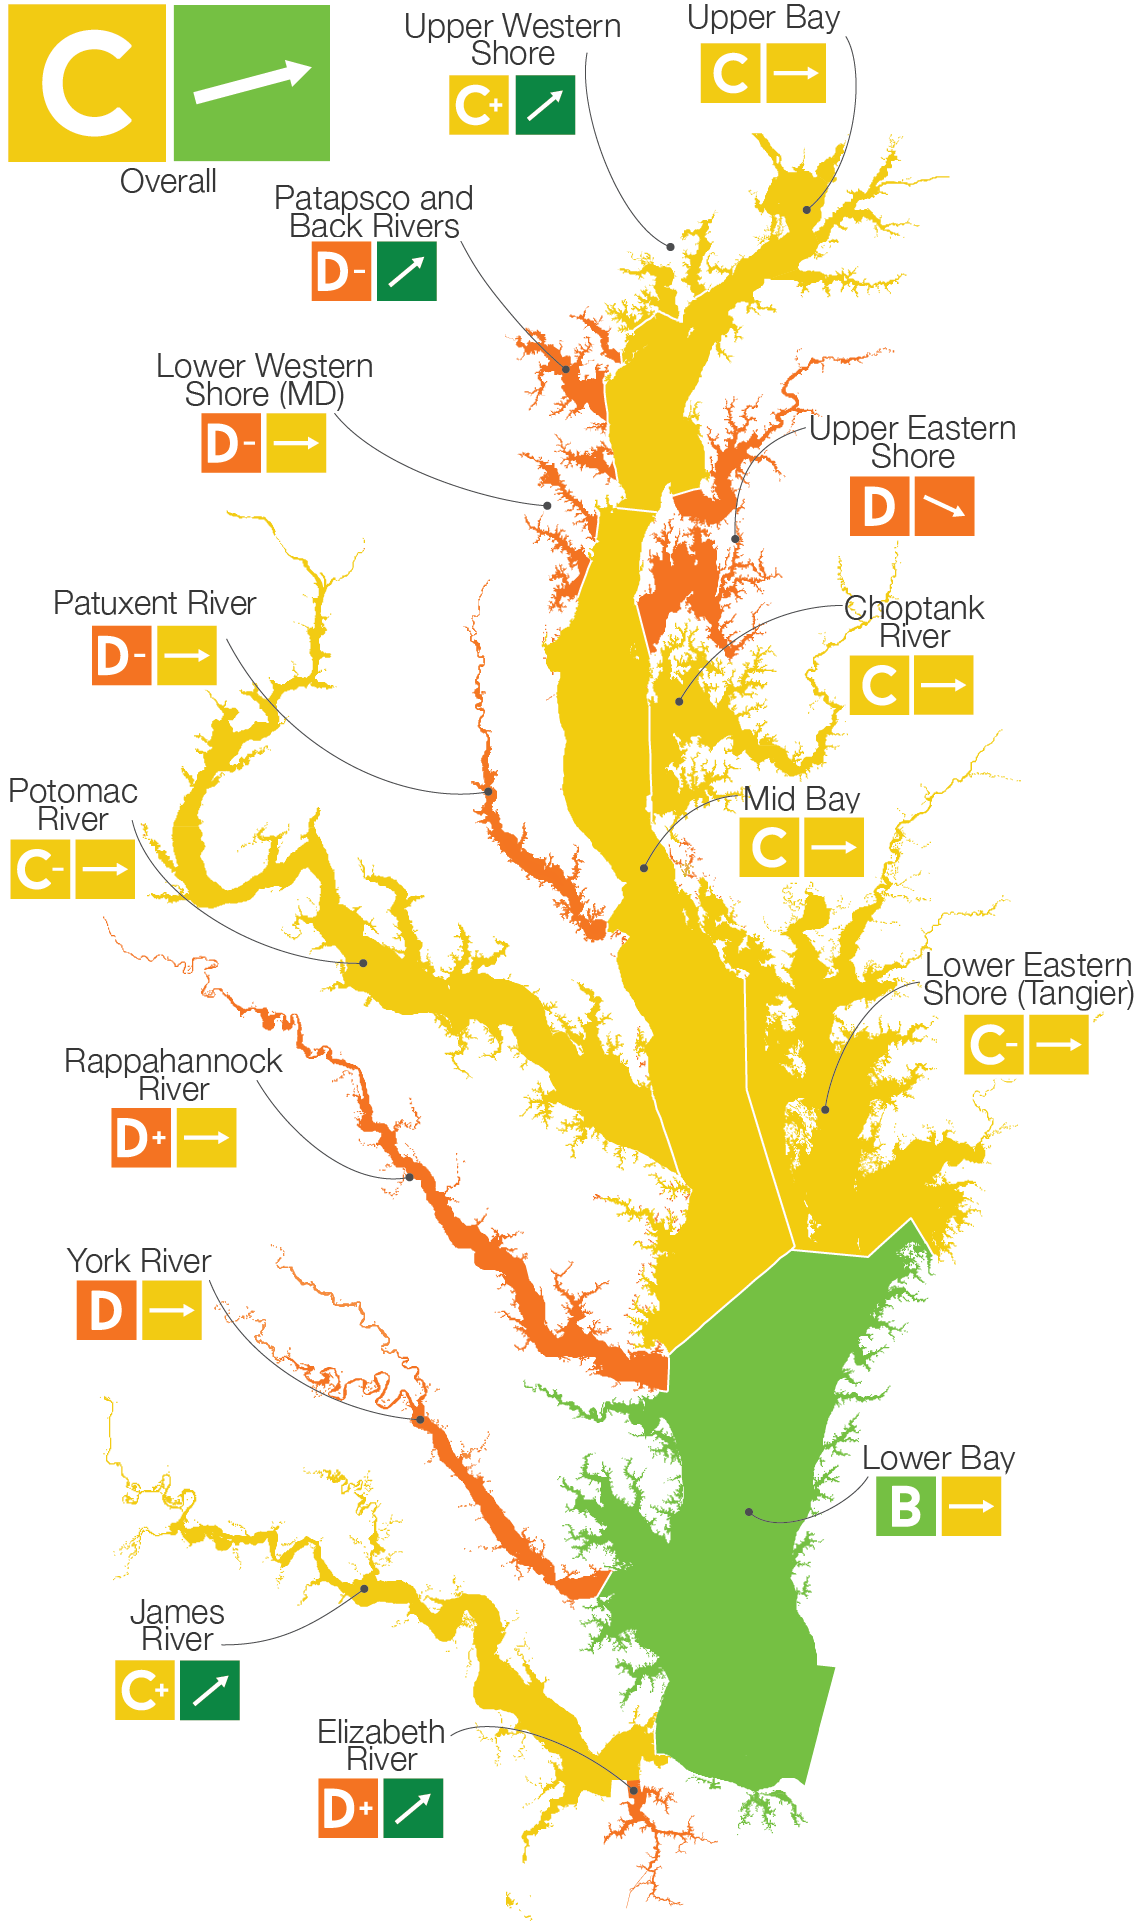
Individual indicators of Bay health had mixed results in 2021, but the overall Bay-wide trend is improving over time, as are many regional trends. Seven reporting regions had improved grades due to better water quality—both nitrogen and phosphorus concentrations continue to improve—and the aquatic grass coverage is improving, but water clarity and chlorophyll continue to degrade. The highest–scoring region was once again the Lower Bay (65%). The lowest–scoring regions were the Patapsco and Back Rivers and the Patuxent River (both 23%).
Long-term trends still show significant improvements in the James River, Elizabeth River, Patapsco and Back Rivers, and Upper Western Shore. The Upper Eastern Shore score has begun a slightly declining trend, the first time a declining trend has been observed in any reporting region since 2014.
VIEW THE REPORT CARD HERE (opens in a new tab)
Dr. William C. Dennison, vice president of science applications at UMCES, stated in revealing this year’s report: “One of the most important messages today is that including economic indicators into our Bay report card metrics is that we must stop pitting the economy versus the environment. Rather, we need to recognize that a healthy economy and a healthy society make for a healthy environment.”
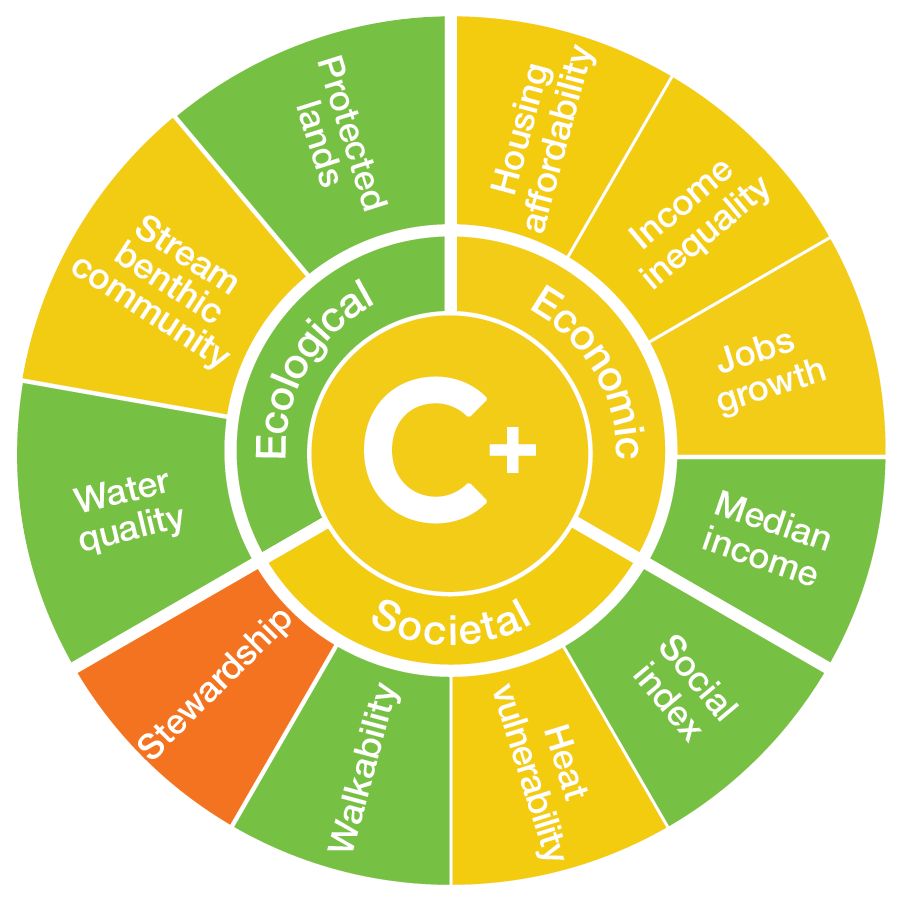
- The Median Household Income indicator, which is a traditional measure of economic health had a good score: 66%.
- The Jobs Growth indicator that measures the net percentage of jobs gained or lost over the past 4 years had a moderate score: 48%.
- The Income Inequality indicator that measures the inequality in income distribution had a moderate score: 50%.
- The Housing Affordability indicator that measures the percent of families that spend more than 30% of their income on housing had a moderate score, 40%.
These new categories and new indicators will allow UMCES to evaluate relationships between socioeconomic factors and environmental conditions, and linkages between different indicators. This is critical to supporting and informing policy and other decisions related to diversity, equity, inclusion, and justice issues, especially around environmental justice. UMCES will begin to evaluate these relationships over the next several years, beginning with the 2022 Chesapeake Bay Watershed Report Card. This work will build on previous additions to the report card indicators, Heat Vulnerability and Walkability, that were added in 2020.
“I want to thank the scientists at the University of Maryland Center for Environmental Science for their hard work in producing a report that is more comprehensive than ever, accounting for the Chesapeake’s economic, ecological and societal factors for the first time,” said Congressman Dutch Ruppersberger. “The Bay’s overall health has been moving in the right direction since UMCES issued its first report card in 2006 and a little progress each day adds up to big results.”
The 2021 Chesapeake Bay and Watershed Report Card has also been setting the standard for guidance globally on collecting and assessing watershed indicators. UMCES plays a key role in international efforts to advance our understanding of how economic, ecological, and societal health impact our environment. In addition to previous report cards implemented in other locations, four international sustainability and research efforts are currently engaged with UMCES, collaborations that will provide additional insights and better inform the way we think about and measure the sustainability of our communities and environment.
The University of Maryland Center for Environmental Science’s Integration and Application Network (opens in a new tab) produces the annual report card which is the most comprehensive assessment of the Chesapeake Bay and its waterways. The report card uses extensive data and analyses in partnership with the National Fish and Wildlife Foundation (NFWF), the Chesapeake Bay Program, academic institutions, and watershed jurisdictions.
In part, support from NFWF has allowed for the addition of data to include social and economic indicators across the entire watershed. For more information about the 2020 Chesapeake Bay Watershed Report Card including region-specific data, visit chesapeakebay.ecoreportcard.org (opens in a new tab).