The University of Maryland Center for Environmental Science (UMCES), along with local partners including the Environmental Sanitation Program for the Municipalities Surrounding Guanabara Bay (PSAM) and the State Environmental Institute (INEA), released the Guanabara Bay Environmental Health Report Card—the first of its kind in Brazil—to track progress of global water management goals.
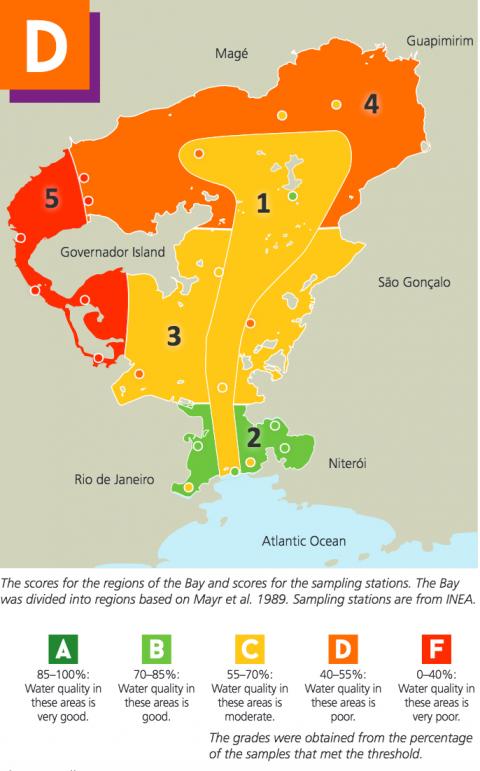
With a grade of D for the Guanabara Bay and its watershed, the report card serves as a model for building comprehensive, community-driven, scientifically credible basin assessments that will help accelerate restoration efforts.
“Around the world, people don’t know enough about the state of their coastal ecosystems. Even if there is scientific data about the basins, it’s rarely in a format that policymakers, advocates or community members can easily understand and use,” said Dave Nemazie, the project lead at the University of Maryland Center for Environmental Science. “Report cards like the one developed for Guanabara Bay condense relevant data into a grade reminiscent of what stakeholders receive in schools. Suddenly the status of the Bay and its watershed is clearer, and informed decisions can be made on how to minimize negative impacts and accelerate restoration efforts.”
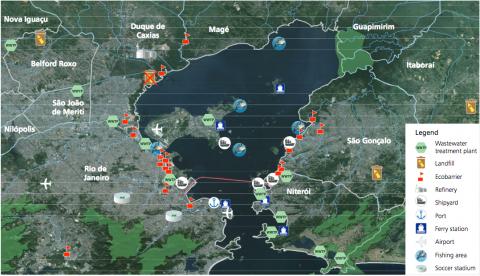
Overall, the report card shows a watershed under stress, facing real and immediate threats from poor sanitation and stormwater systems, loss of forest cover, and ecosystem transformation. The results emphasize the need for infrastructure investments and land use planning to ensure pollution is significantly reduced. The good news is that due to the high amount of mixing between the Bay and the Atlantic Ocean, once this infrastructure is in place, significant portions of the Bay should show immediate improvement.
Report cards like the one developed for Guanabara Bay condense relevant data into a grade reminiscent of what stakeholders receive in schools. Suddenly the status of the Bay and its watershed is clearer, and informed decisions can be made on how to minimize negative impacts and accelerate restoration efforts.
Analyses like the environmental health report card are designed to act as a snapshot of an ecosystem and related changes, which happen slowly over a long period of time.
An initial basin report card gives policy makers, conservationists and all water users a baseline by which to measure progress or decline in basin health, while subsequent reports can identify slow-moving but critical threats and provide feedback of what solutions are improving basin health. This is especially important as coastal cities develop and try to balance growth while maintaining natural resources.
“The use of an environmental health report card is a new integrative report that analyzes monitoring data in a way that helps us make future decisions about restoration investments,” said Marlus Oliveira, Coordinator of the Environmental Sanitation Program for the Municipalities Surrounding Guanabara Bay (PSAM). “It also serves as a way to communicate complex data into a format a broad audience can understand.”
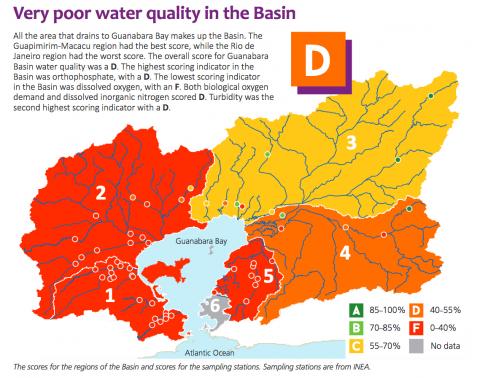
In the Guanabara Bay environmental health report card, UMCES, PSAM, and INEA convened hundreds of local individuals representing more than 50 organizations throughout the watershed. Through a series of workshops, the stakeholders determined the most important values and threats to their basin, and then assigned indicators based on data that could be used to score those values. For example, the Guanabara Bay is plagued by low dissolved oxygen, which is critical to fish populations, therefore the key indicators are not only oxygen but also the pollution that reduces its levels.
“We know that in the real world, data is just part of the story. Water touches so many people,” said Newton. “Therefore, we need to engage citizens and document our progress in new ways to broaden the involvement of all people, communities, governments within the Guanabara Bay watershed to make real lasting improvements.”
The complete report card and other indicators can be explored online at https://ecoreportcard.org/report-cards/guanabara-bay/
Environmental health report cards have been used in multiple watersheds throughout the world, including the Chesapeake Bay, Gulf of Mexico and Long Island Sound (United Staets), Chilika Lake (India), Laguna de Bay (Philippines), Great Barrier Reef (Australia), Orinoco River (Colombia), among others. These report cards have helped bring together stakeholders through group learning, analyzed and integrated monitoring data, identified values and threats, and set priorities for restoration.