Chesapeake Bay health showing significant improvement over time
The overall health of the Chesapeake Bay is showing significantly improving trends over time, but some regions still score poorly, reported the University of Maryland Center for Environmental Science (UMCES) in its annual Chesapeake Bay and Watershed Report Card released today. Similar to 2021, the overall Chesapeake Bay received a C grade.

New Environmental Justice Index shows strong disparities
The overall health of the Chesapeake Bay is showing significantly improving trends over time, but some regions still score poorly, reported the University of Maryland Center for Environmental Science (UMCES) in its annual Chesapeake Bay and Watershed Report Card released today. Similar to 2021, the overall Chesapeake Bay received a C grade.
“While the trajectory of improvements, particularly concerning nutrients in the Bay, is in the right direction, we need to pick up the pace of restoration so that we can hit our nutrient reduction targets in the future and ensure our resilience to climate change,” said Peter Goodwin, president of the University of Maryland Center for Environmental Science.
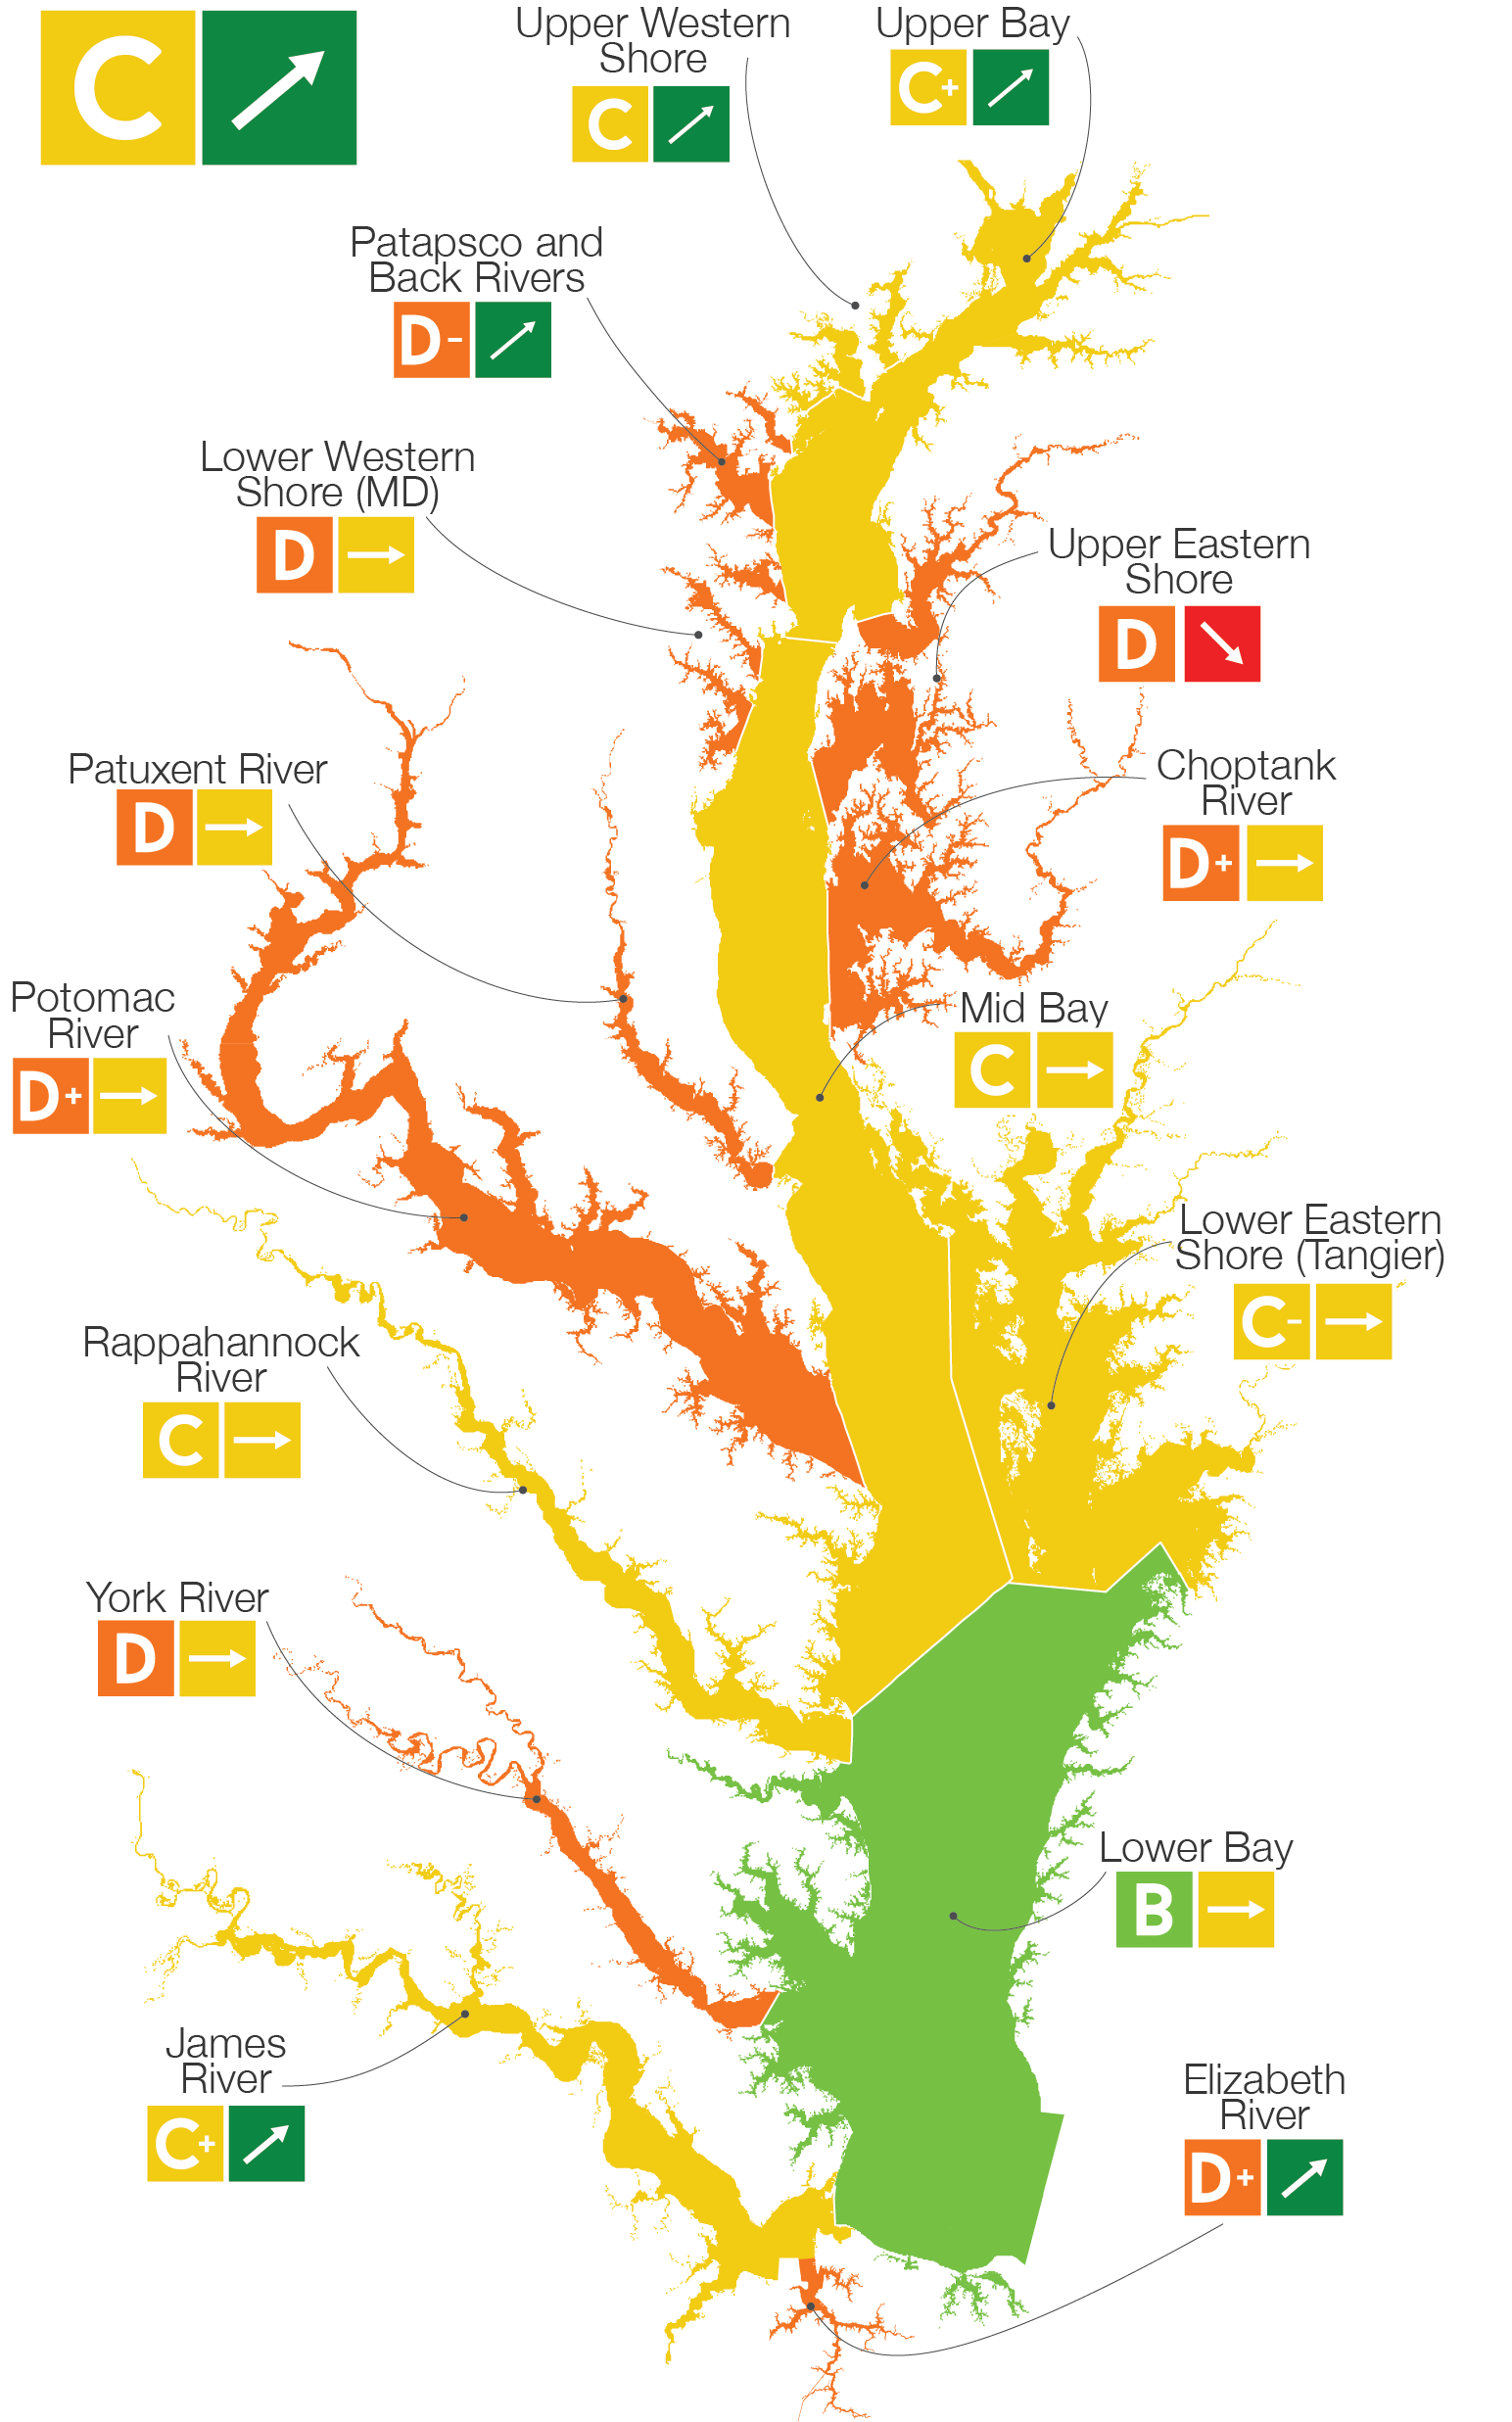
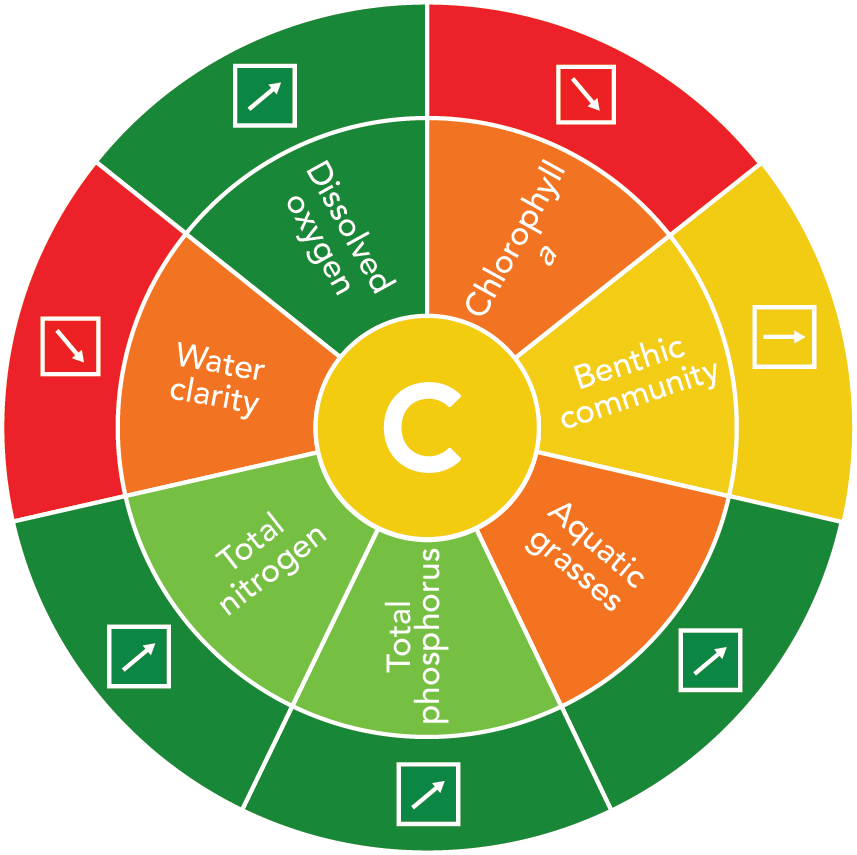
The overall Bay health score has increased by six points in the past two years, an encouraging sign in the recovery of the Bay. Of the seven indicators, there were improvements in water clarity, nitrogen, phosphorus, and aquatic grasses. Although conditions in the bay overall are improving, many bay tributaries still have poor scores with a concerning trend of poor scores in the Eastern Shore watersheds.
“A clean Bay supports a healthy economy and a healthy environment. That’s why we’ve fought so hard to protect and restore this national treasure, and this progress shows that the historic federal investments are making a real difference. While this is a positive step forward, we know that we still have much work ahead to ensure a healthy Bay for today and generations to come,” said U.S. Senator Chris Van Hollen of Maryland.
Watershed health was scored in three categories—Ecological, Societal, and Economic health. In 2022, Ecological scored a B-, Societal scored a C, and Economic scored a C. Overall, the ecological, social, and economic conditions on the Eastern Shore of Maryland and Virginia are worse than other regions across all three categories. This helps explain the poor Bay scores for the Eastern Shore tributaries.
This year is the first time an integrated environmental justice index has been included in the report card. Environmental Justice is about creating a healthy and equitable society in the Chesapeake Bay watershed. The Environmental Justice Index developed by the Centers for Disease Control and Prevention and Agency for Toxic Substances Disease Registry, in partnership with the Department of Health and Human Services’ Office of Environmental Justice, includes social vulnerability, environmental burden, and health vulnerability indicators. Overall, there are strong disparities in different areas of the watershed. Cities and rural areas tend to experience higher relative impacts, and more suburban areas tend to experience lower relative impacts.
“The addition of the Environmental Justice Index provides a more holistic perspective of Chesapeake Bay and watershed health than has previously been available,” said Bill Dennison, Vice President for Science Application at the University of Maryland Center for Environmental Science. “This holistic approach will make sure the report card is relevant to all communities in the Chesapeake watershed. We need to have healthy communities to ensure that we achieve a healthy Chesapeake Bay. Addressing environmental justice is critical to ensure that restoration enhances long-term sustainability of the Chesapeake Bay watershed in an equitable way.”
The Environmental Justice Index characterizes the cumulative impacts and patterns of environmental injustice across the watershed. The index considers social factors such as poverty, race, ethnicity, and pre-existing health conditions, which can increase these impacts. The Environmental Justice Index was not included in the calculations for the 2022 Watershed Health score, pending additional input from bay communities.
The University of Maryland Center for Environmental Science’s Integration and Application Network produces the annual report card, which is the most comprehensive assessment of the Chesapeake Bay and its waterways. The report card uses extensive data and analysis in partnership with the National Fish and Wildlife Foundation (NFWF), the Chesapeake Bay Program, academic institutions, and watershed jurisdictions. For more information about the 2022 Chesapeake Bay Watershed Report Card including region-specific data, visit chesapeakebay.ecoreportcard.org.