Study shows Bay clean up helps boost underwater grasses
A major new study comparing water quality and coverage of underwater grasses throughout Chesapeake Bay from 1984 to 2006 shows a clear link between the abundance of submerged aquatic vegetation (SAV) and levels of nitrogen in Bay waters. When nitrogen levels rise, SAV coverage decreases. When nitrogen levels fall, SAV meadows expand.
A major new study comparing water quality and coverage of underwater grasses throughout Chesapeake Bay from 1984 to 2006 shows a clear link between the abundance of submerged aquatic vegetation (SAV) and levels of nitrogen in Bay waters. When nitrogen levels rise, SAV coverage decreases. When nitrogen levels fall, SAV meadows expand.
SAV meadows provide nursery and foraging habitat for blue crabs, striped bass, waterfowl, and other key species; protect the bayfloor from erosion by waves, tides, and currents; and add oxygen to the water through photosynthesis.
The multi-institutional study -including UMCES scientists Drs. Michael Williams, Tim Carruthers, Michael Kemp, and William Dennison along with colleagues from the Virginia Institute of Marine Science, the U.S. Geological Survey, NOAA, and the U.S. Environmental Protection Agency – also shows that current SAV coverage remains below restoration targets in almost all areas.
Lead author Robert “JJ” Orth of VIMS says the study’s results “clearly indicate that SAV abundance and associated ecosystem services are limited by continued poor water quality – specifically high nutrient concentrations – within Chesapeake Bay.”
The strong correlation in some tributaries between nutrient reductions and SAV increases shows that management activities have already contributed toward local SAV restoration targets. But the strong negative correlation between nitrogen and SAV abundance in baywide data suggests that further nutrient reductions will be necessary for SAV to attain or exceed restoration targets for the Bay as a whole.
Study co-author Dr. Michael Williams, of the UMCES Integration and Application Network, says “By investigating a broad array of water-quality parameters, this research allows us to conclude that nutrient pollution is the major determinant of SAV abundance throughout Chesapeake Bay. This type of analysis provides direct evidence that environmental improvements are possible in the Chesapeake.”
Adds Orth, “Our study shows that despite increases in bay-grass coverage in some tributaries and salinity zones, there is a lot of work to be done in reducing nutrient loadings to the Bay.” He and his co-authors write that “nutrient-reduction strategies should still be the first priority in all salinity zones.”
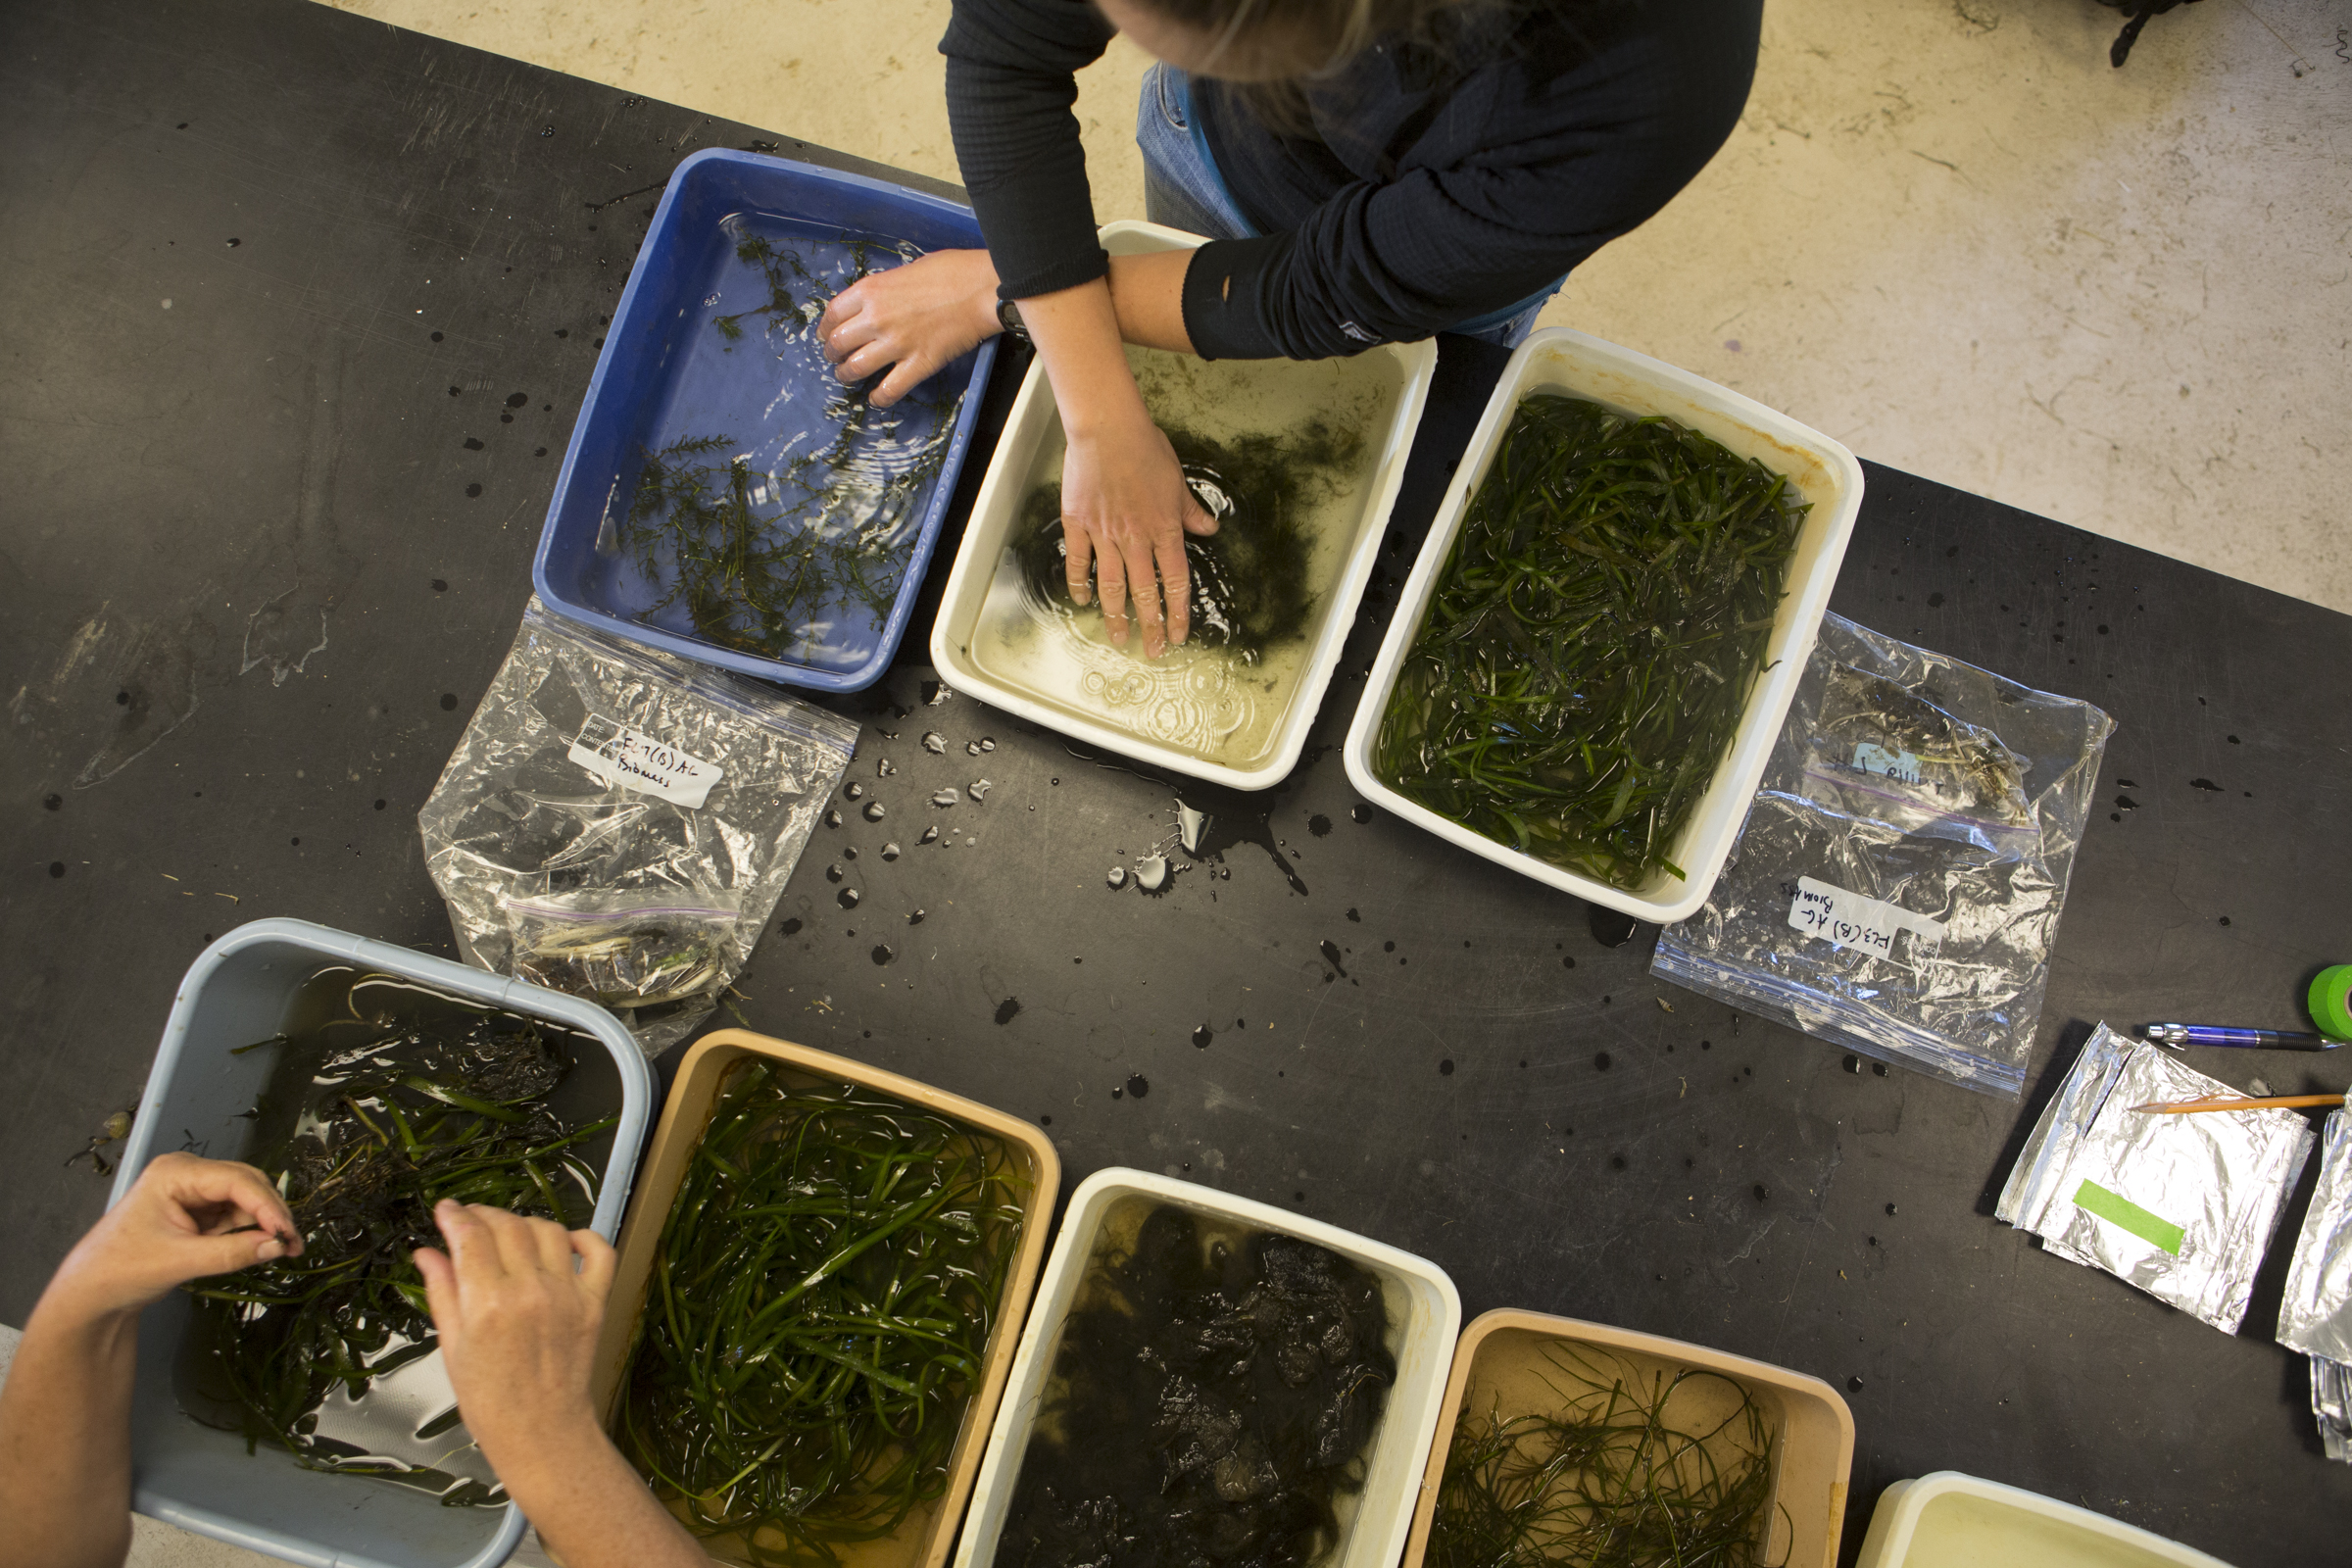
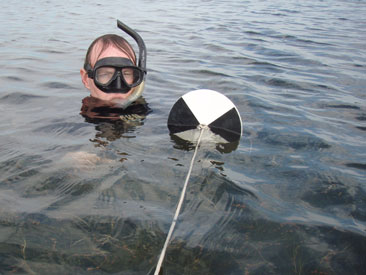
The study, to appear this fall in Estuaries and Coasts, is now available on the web via the journal’s early on-line edition (opens in a new tab). Study data come from aerial surveys of bay-grass distribution and abundance flown by VIMS scientists each year between 1984 and present, and from monthly to bi-monthly water-quality measurements recorded at numerous monitoring stations throughout the mainstem Bay and its tributaries.
Orth says “This isn’t a computer model or a laboratory experiment, although it confirms the findings of both. It’s a study of 22 years of field data measuring water quality and SAV coverage throughout the entire Bay.”
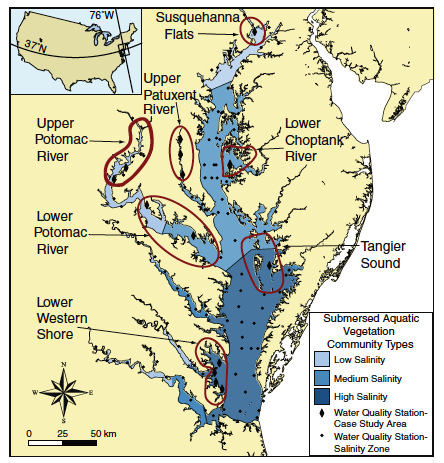
The investigators compared water quality and bay-grass trends at a variety of spatial scales: over the entire Bay, in 3 different salinity zones, and in 7 case studies of smaller areas in Virginia and Maryland: the Susquehanna Flats, the upper Patuxent River, the upper and lower Potomac River, the lower Choptank River, Tangier Sound, and the lower western shore near the mouth of the York River. The goal was to “identify the most informative scale for synthesizing monitoring data to assess system changes.”
The salinity zones correspond to different bay-grass communities: a highly diverse freshwater community of 13 native and invasive grass species including wild celery and hydrilla; a medium-salinity community comprised of widgeon grass, eelgrass, and three other species; and a high salinity community dominated by eelgrass.
Orth says that the study’s results “reflect the complex relationships found in the Bay due to the high diversity of its SAV community.” The study showed that SAV abundance increased in the Chesapeake by 1-28% per year between 1984 and 2006, but that trends within the Bay’s different salinity zones and case-study areas varied. At the salinity-zone level, SAV has:
- continually increased in the low-salinity region, with 166% more SAV coverage in 2006 than 1984;
- increased initially in the medium-salinity region, followed by fluctuating abundances with a 261% increase by 2006; and
- increased initially in the high-salinity region, followed by a subsequent decline with abundance 22% less in 2006 compared to 1984.
In all areas, consistent negative correlations between measures of SAV abundance and nitrogen loads or concentrations suggest that meadows are responsive to changes in nitrogen inputs. For the smaller case-study areas, different trends in SAV abundance and the percent change in SAV abundance included positive correlations to water clarity in high-salinity areas.
Reductions in nitrogen loads to the Bay are a key component of the EPA’s new plan to restore Bay health, which builds on the Executive Order signed by President Obama in 2009. Obama’s Executive Order empowered the EPA to set more stringent standards and penalize states that failed to meet them.
Excessive inputs of nitrogen to the Bay -from smokestacks, tailpipes, farm and yard fertilizers, sewage treatment plants, and septic tanks – help fuel algal growth, which in turn shades the grasses and limits their ability to photosynthesize. Runoff of sediments from disturbed areas on land also stresses SAV, by clouding the clear waters they need to thrive.