Student Outcomes
-
supporting 15 faculty and 14 students
-
supporting 23 faculty and 22 students
-
supporting 29 faculty and 28 students
-
supporting 9 UMCES faculty and 16 students
-
4 faculty
-
6 students
Graduate Student Enrollment Programs
UMCES graduate students reside and conduct research at one of our research laboratories through these programs:
- A joint Marine Estuarine Environmental Sciences (MEES) graduate degree program with the University System of Maryland.
- Masters Program at Frostburg State University in Applied Ecology & Conservation Biology or Wildlife/Fisheries Biology
- A Professional Master of Environmental Management (MEM) in Sustainability
MEES Program
The MEES Program offers 4 Foundation Areas. UMCES faculty members advise students in all 4 Foundation Areas:
- Environment, Health, and Society
- Earth and Ocean Systems
- Ecological Systems
- Environmental Molecular Science and Technology
MEES Graduate Student Application Summary
Data from the UMCES student applications to the MEES UMD system-wide program. More than 90% of UMCES students applied to the MEES program. Source: MEES Program Office
Fall 2023-2024 MEES Application Information
| 2023 | 2024 | |
|---|---|---|
| Number of Applications | 79 | 109 |
| Number Admitted | 21 | 36 |
| Number Enrolled | 15 | 12 |
| Percent Admitted | 26.6% | 33.0% |
| Percent Enrolled | 71.4% | 33.3% |
Spring 2023-2024 MEES Application Information
| 2023 | 2024 | |
|---|---|---|
| Number of Applications | 6 | 8 |
| Number Admitted | 5 | 6 |
| Number Enrolled | 5 | 5 |
| Percent Admitted | 83.3% | 75% |
| Percent Enrolled | 100% | 83.3% |
*Note Regarding GRE Scores*
As of summer 2018, the MEES Program has decided to no longer require students to submit GRE scores with their application. Students who have taken the GRE and would like to have their scores included in their application may choose to submit them. GRE scores will not be considered for admission, but may be part of an individual faculty member’s advising decision.
UMCES Graduate Student Enrollment Summary
| Number of UMCES Students Enrolled in MEES by Foundation Area | Masters Students – Fall 2021-Spring 2025 | Masters Students – Fall 2025 | PhD Students – Fall 2021-Spring 2025 | PhD Students – Fall 2025 |
|---|---|---|---|---|
| Environmental Chemistry | – | – | – | – |
| Ecology | – | – | – | – |
| Environmental Molecular Biology/Biotechnology | – | – | – | – |
| Environmental Science | – | – | – | – |
| Fisheries Science | – | – | 1 | 1 |
| Oceanography | 1 | 1 | – | – |
| Earth and Ocean Systems * | 22 | 9 | 23 | 15 |
| Ecological Systems * | 25 | 8 | 32 | 20 |
| Environment and Society * | 5 | 2 | 10 | 5 |
| Environmental Molecular Science and Technology * | 5 | 1 | 15 | 14 |
* In 2016, the MEES Program implemented a new and overhauled curriculum, which included four new foundation areas (starred). Students matriculating in fall 2016 had the option of choosing between the old Areas of Specialization or the new foundation areas. Students matriculating since the fall 2016 have all been enrolled in the new foundation areas.
| Total UMCES Student Enrollment by Location | Fall 2021-Spring 2025 | Fall 2025 |
|---|---|---|
| Appalachian Laboratory | 24 | 12 |
| Chesapeake Biological Laboratory | 51 | 21 |
| Horn Point Laboratory | 47 | 27 |
| Institute of Marine and Environmental Technology | 26 | 18 |
Our Master of Environmental Management had 6 students enrolled in fall 2025.
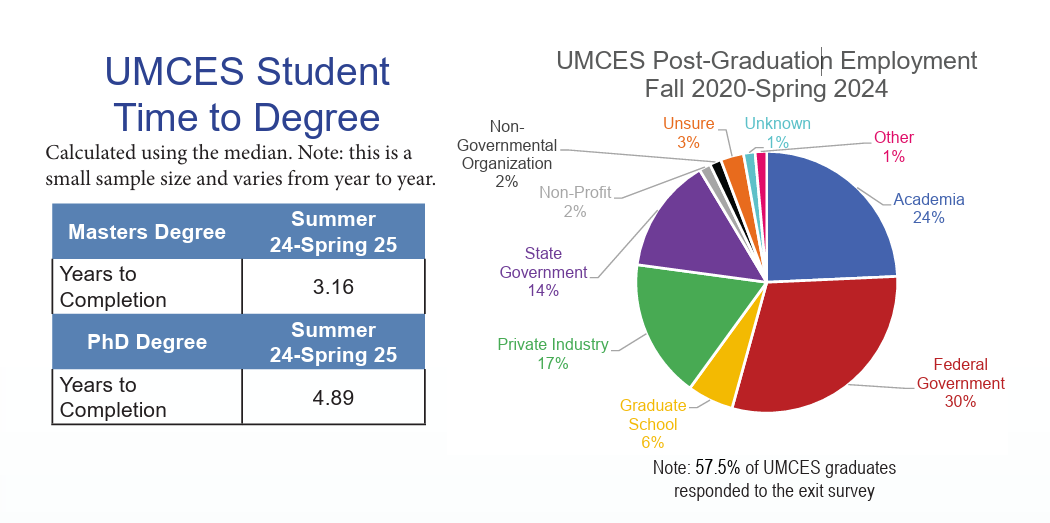
UMCES Student Statistics and Outcomes
data from Fall 2025
Note: these percentages are based on application data that was collected over multiple years. Because response options have changed over time, the percentages may not fully represent the current enrolled population.
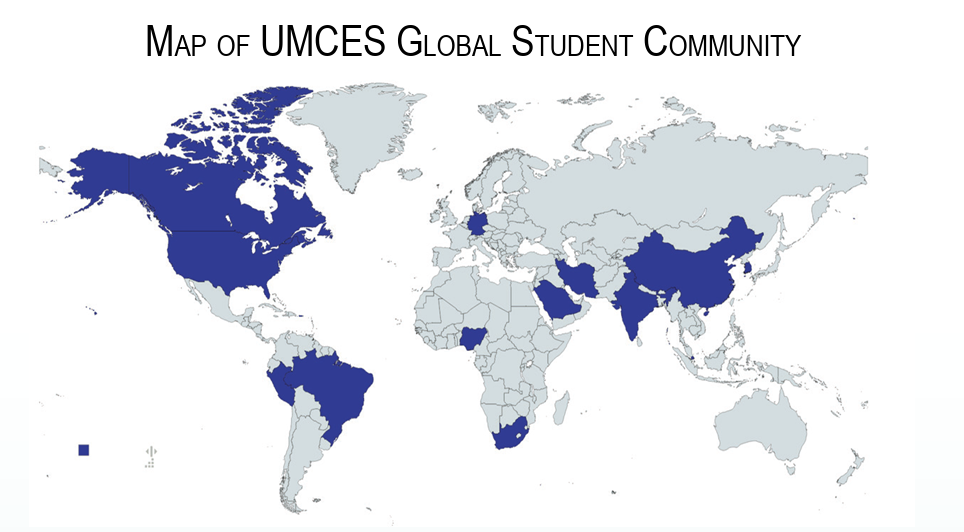
The Fall 2024 UMCES Global Student Community represents both U.S. states and an additional 14 countries from North America (2), South America (2), Africa (2), Europe (1), and Asia (7).
UMCES Graduate Student Degree Summary
| Degrees Awarded to UMCES Students by Area of Specialization | Masters Degrees – Summer 2017-Spring 2024 | Masters Degrees – Summer 2024 – Spring 2025 | PhD Degrees – Summer 2017-Spring 2024 | PhD Degrees – Summer 2024 – Spring 2025 |
|---|---|---|---|---|
| Environmental Chemistry | 1 | – | 3 | – |
| Ecology | 5 | – | 3 | – |
| Environmental Molecular Biology/Biotechnology | 2 | – | 5 | – |
| Environmental Science | 4 | – | 8 | – |
| Fisheries Science | 6 | – | 4 | – |
| Oceanography | 2 | – | 11 | – |
| Earth and Ocean Systems * | 24 | 5 | 10 | 2 |
| Ecological Systems * | 13 | 5 | 14 | 2 |
| Environment and Society * | 4 | – | 6 | – |
| Environmental Molecular Science and Technology * | 4 | 2 | 5 | 2 |
Definitions
International Student
Based on the permanent residence and citizenship where a student is/was living at the time of application submission to the MEES office.
Student Retention Rate
The proportion of new, full-time, degree-seeking students who started in a given cohort year and are enrolled at UMCES the following year.
Student Completion Rate
The proportion of graduate students during a certain matriculation window with a known outcome: those who completed their degree versus those who left the program without completing
For additional information please visit:
https://www.umces.edu/graduate-program
Images were provided by the Integration and Application Network University of Maryland Center for Environmental Science